Visualization: CNN Activations
We already saw that the custom architecture/model works, but it's surely not the best we could come up with. The question is, how can we improve its performance and get some intuition on how it works?
Seeing what the network sees
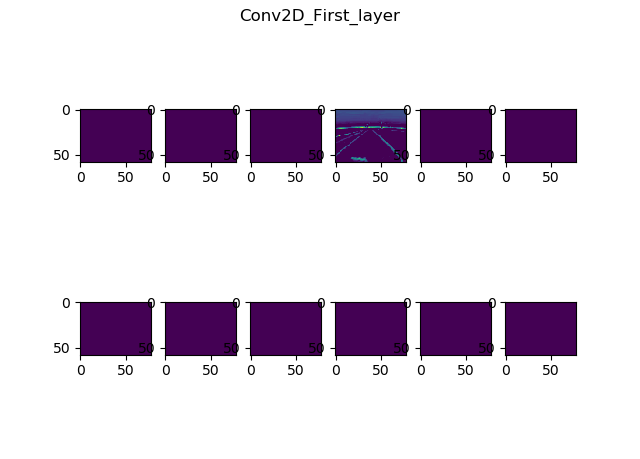
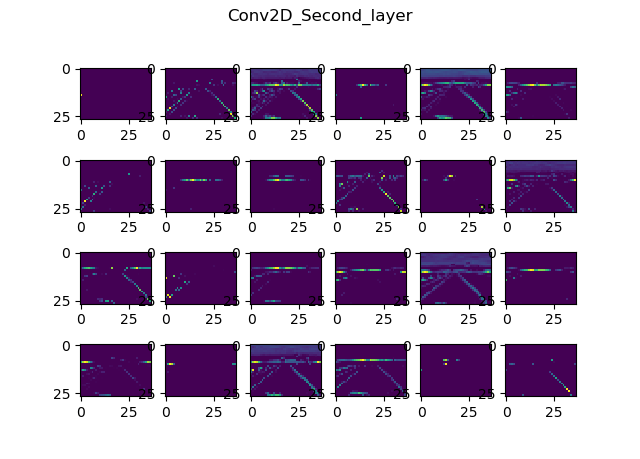
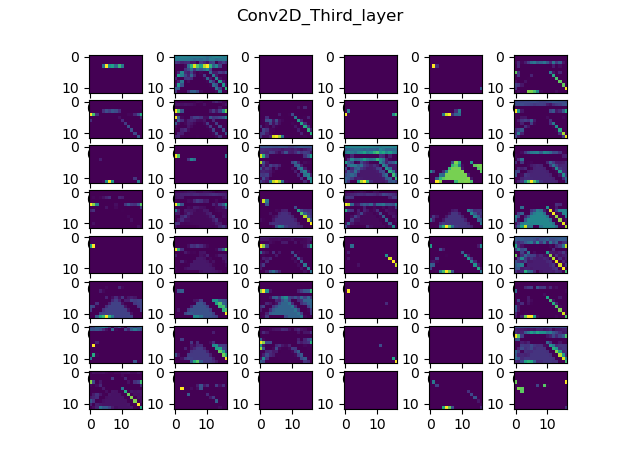
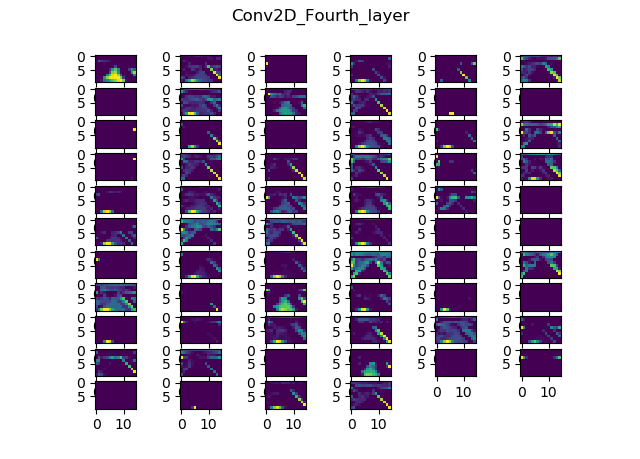
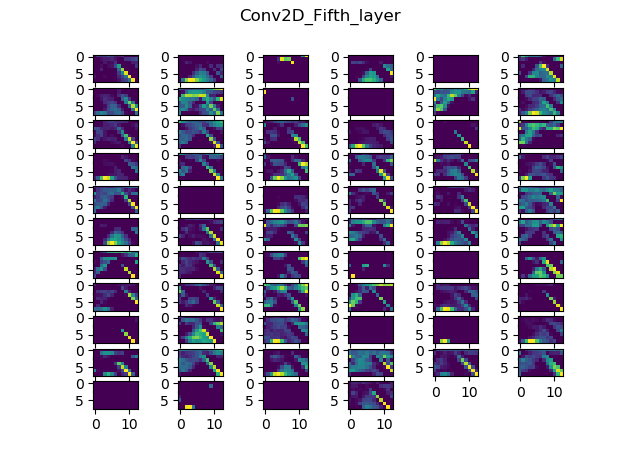
One useful visual tool we could use is Donkey's built in cnnactivations command. Per the official docs, it shows us the feature maps for each convolutional layer in the model we pass to it. The feature maps show us how each filter in every conv layer activates, given the input image we pass to it.
The tool currently works with only 2D convolutional layers.
You can use the command as follows:
donkey cnnactivations --model pathTo/yourModel.h5 --image pathTo/anImage.jpg
Here are the results I got while running this picture through the Nvidia model we've trained previously:
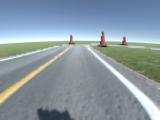
Input resolution?
Now, we can see a couple of things, but most notably, that it's hard to actually see things on these images. And in case you're wondering, it's not because they're resized. They're pretty low res, since the input image is only 160x120 and due to the nature of convolutions it only gets smaller.
The formula for the output size of a convolutional layer is: ++ \Big\lfloor{\frac{n+2p-f}{s}+1}\Big\rfloor ++ Where $n$ is an input dimension, $p$ is the padding, $f$ is the number of filters and $s$ is the stride size.
Let's calculate the output size of our first convolutional layer, which was:
x = Convolution2D(filters=12, kernel_size=5, strides=(2, 2), input_shape = input_shape, activation='relu', name="Conv2D_First_layer")(x)
The input dimensions of our image are 160 and 120, the other parameters are easily seen, except for the padding, which is valid (aka zero), since we didn't specify it explicitly.
++ width=\Big\lfloor{\frac{160-5}{2}+1}\Big\rfloor = \Big\lfloor{78.5}\Big\rfloor = 78 ++
++ height=\Big\lfloor{\frac{120-5}{2}+1}\Big\rfloor = \Big\lfloor{58.5}\Big\rfloor = 58 ++
So after the first layer, we'll have 12 filters (or images) with the size of 78x58. Let's look at the other layers:
- Second layer: 37x27, 24 filters
- Third layer: 17x12, 48 filters
- Fourth layer: 8x5, 64 filters
- Fifth layer: 3x2, 64 filters
So yeah, those are some small resolutions. I mean, it will work, but when you think about it, would you be able to perfectly drive a car, if your eyes saw this:
The smaller images are around 3.2KB each, and the bigger ones are around 22KB each, which is almost seven times as big, for a fourfold increase in resolution. So you can probably imagine, it's more expensive computationally, but it also offers way more data to the network to work with.
The images are by default smaller because Donkey was originally made for the Raspberry Pi, which doesn't have a discrete GPU, so it can handle a lot less computationally intensive tasks. But since we're working with a Jetson, we should be able to increase the resolution a bit, and if necessary implement some feature engineering and preprocessing to speed things up a little on higher res inputs.
So we'll be increasing the input resolution to be able to train more complex models.
Let's move on to another visualization technique: saliency maps!